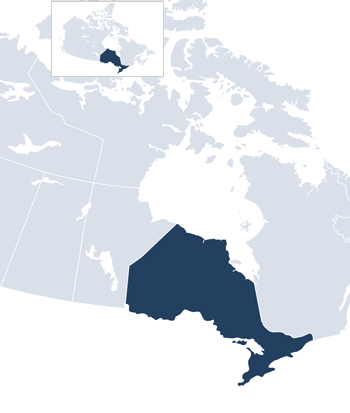
Ontario's Profile
Economic Indicators in 2021
- Gross domestic product (GDP): $956.7 billion
- GDP per capita: $64,600
- Population: 14.8 million
- International merchandise exports and imports: 53.7% of GDP
Economic Activity by Sector in 2022
- Goods: 22.9% of GDP
- Manufacturing: 11.0% of total GDP
- Construction: 7.9% of total GDP
- Services: 77.1% of GDP
- Real estate, and rental and leasing: 12.6% of total GDP
- Finance and insurance: 10.0% of total GDP
- To display precise values: Hover over data points, bars and segments.
- To show or hide certain elements of a bar chart or a chart with plotted points: Click on their names in the legend.
- To highlight specific segments of a pie chart: Click on the segments and/or rotate the chart.
In addition, you can download each chart individually to multiple formats by clicking on the "Download figure" button at the top right of the chart. Before downloading bar charts and charts with plotted points, you may turn datasets on or off.
Michel Cristerna
Research and Education
Publication No. 2023-504-E
11 October 2023
Ontario's Merchandise Trade
Ontario's merchandise trade with the world in 2021: $513.4 billion
- Exports: $227.2 billion, a 6.7% increase from 2020
- Imports: $286.1 billion, a 9.9% increase from 2020
Trade deficit in 2021: $58.9 billion, an increase from $47.4 billion in 2020
Exports in 2021: 35.9% of the total value of Canadian exports, a decrease from 41.1% in 2020
Imports in 2021: 43.8% of the total value of Canadian imports, a decrease from 44.7% in 2020
Exports as a percentage of GDP in 2021:
- Ontario – 23.8%, a decrease from 24.6% in 2020
- Canada – 25.2%, an increase from 23.5% in 2020
Imports as a percentage of GDP in 2021:
- Ontario – 29.9%, a decrease from 30.0% in 2020
- Canada – 26.0%, a decrease from 26.4% in 2020
Exports in 2022:
- Resource-based goods – 10.3%, a decrease from 10.7% in 2021
- Manufactured goods – 89.7%, an increase from 89.3% in 2021
Highest-valued exports in 2022: Motor vehicles and gold, together accounting for 19.6% of the total value of provincial exports
- Motor vehicles: $36.0 billion, an increase from $34.2 billion in 2021
- Gold: $17.6 billion, an increase from $16.8 billion in 2021
Major export destinations, by region, in 2022:
- United States, at 85.0% of the total value of exports
- Europe, at 6.5% of the total value of exports
- Asia, at 4.5% of the total value of exports
Major export destinations, by country, in 2022:
- United States, at $220.5 billion
- United Kingdom, at $13.9 billion
- Germany, at $3.8 billion
Ontario's Services Trade
Ontario's services trade with the world in 2021: $140.0 billion
- Exports: $75.3 billion, a 3.3% increase from 2020
- Imports: $64.8 billion, a 4.1% increase from 2020
Trade surplus in 2021: $10.5 billion, a decrease from $10.7 billion in 2020

