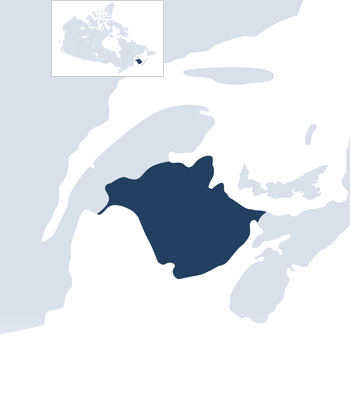
New Brunswick
Economic Indicators in 2023
- Gross domestic product (GDP): $47.0 billion
- GDP per capita: $56,500
- Population: 832,200
- International merchandise exports and imports: 82.7% of GDP
Economic Activity by Sector in 2023
- Goods: 25.0% of GDP
- Manufacturing: 9.8% of total GDP
- Construction: 7.5% of total GDP
- Services: 75.0% of GDP
- Real estate, and rental and leasing: 13.3% of total GDP
- Public administration: 11.5% of total GDP
Fundamentals for this Profile
Provincial and territorial profiles provide international trade data; the data exclude trade within Canada.
Trade data are measured on a balance-of-payments basis except for the following, which are customs-based: export shares by sector; exports by product category; and exports by destination.
Provincial import data by sector, by product category and by trading partner are not provided because of data limitations.
The balance of payments–based data and customs-based data should not be compared due to different methodologies.
GDP is measured at market prices, except GDP by sector, which is measured at basic prices.
GDP per capita is calculated by dividing provincial GDP by provincial population.
International merchandise exports and imports as a percentage of GDP is calculated by dividing the sum of merchandise exports and merchandise imports by provincial GDP.
The five most highly valued merchandise export categories have been identified using values for 2024.
At preparation, reliable data on provincial merchandise and services imports were available only until 2023.
All figures were prepared using Statistics Canada data available in winter 2024. Numbers have been rounded.
For the data tables used to generate the figures, see the HTML version of this profile at Trade and Investment Series.
Definitions are available.
Definitions appear at the end of the profile.
- To display precise values: Hover over data points, bars and segments.
- To show or hide certain elements of a bar chart or a chart with plotted points: Click on their names in the legend.
- To highlight specific segments of a pie chart: Click on the segments and/or rotate the chart.
In addition, you can download each chart individually to multiple formats by clicking on the "Download figure" button at the top right of the chart. Before downloading bar charts and charts with plotted points, you may turn datasets on or off.
Anthony Tazbaz
Research and Education
Publication No. 2024-506-E
06 March 2024
New Brunswick's Merchandise Trade
- New Brunswick’s merchandise trade with the world in 2023: $38.9 billion
- Exports: $15.5 billion, a 9.3% decrease from 2022
- Imports: $23.4 billion, a 2.0% decrease from 2022
- Trade deficit in 2023: $7.8 billion, an increase from $6.7 billion in 2022
- Exports in 2023: 2.0% of the total value of Canadian exports, a decrease from 2.2% in 2022
- Imports in 2023: 3.0% of the total value of Canadian imports, unchanged from 2022
- Exports as a percentage of GDP in 2023:
- New Brunswick: 33.0%, a decrease from 37.6% in 2022
- Canada: 25.9%, a decrease from 27.1% in 2022
- Imports as a percentage of GDP in 2023:
- New Brunswick: 49.7%, a decrease from 52.3% in 2022
- Canada: 26.9%, a decrease from 27.5% in 2022
- Exports in 2024:
- Resource-based goods: 6.2%, an increase from 6.1% in 2023
- Manufactured goods: 93.8%, a decrease from 93.9% in 2023
- Highest-valued exports in 2024: Refined petroleum and crustaceans, together accounting for 59.7% of the total value of provincial exports
- Refined petroleum: $9.5 billion, an increase from $9.4 billion in 2023
- Crustaceans: $962.3 million, an increase from $841.5 million in 2023
- Major export destinations, by country, in 2024:
- United States, at 90.2% of the total value of exports
- China, at 1.2% of the total value of exports
- India, at 1.1% of the total value of exports
- United Kingdom, at 0.6% of the total value of exports
- Bonaire, St. Eustatius and Saba, at 0.6% of the total value of exports
- All other destinations, at 6.3% of the total value of exports
New Brunswick's Services Trade
- New Brunswick’s services trade with the world in 2023: $4.3 billion
- Exports: $2.0 billion, a 13.4% increase from 2022
- Imports: $2.3 billion, a 12.7% increase from 2022
- Trade deficit in 2023: $263 million, an increase from $244 million in 2022
