The purpose of Canada’s retirement income system is twofold: to alleviate poverty among seniors and to help seniors who are better off to avoid significant declines in living standards when they retire. This HillStudy outlines the different components of the system, who they target, how much they cost and how they are financed. While there is general agreement that the retirement income system is a policy success story, a broader discussion of how well the system is meeting its objectives today and what might need to be reformed if the system is to continue to function well into the future will be left for another day.
To understand how this collection of programs and policy measures works to support seniors in attaining and maintaining a decent standard of living requires viewing them as a system. In turn, it is helpful to think of this retirement income system as being composed of three distinct pillars.
The first pillar provides benefits based on age and years of residence in Canada. It includes the Old Age Security (OAS) pension, the Guaranteed Income Supplement (GIS), the Allowance and the Age Credit. Generally referred to as the foundation of the system, the first pillar uses a mix of universal and means-tested programs to create a minimum level of income. This ensures that seniors can afford the necessities of life: food, shelter, heating and clothing. The first pillar is financed primarily through general tax revenue.
The second pillar consists of mandatory earnings-related programs: the Canada Pension Plan (CPP) and, in Quebec, the Quebec Pension Plan (QPP). These public pensions are funded primarily through mandatory contributions by employers, employees and the self-employed. As benefits are based upon age and the amount contributed over a person’s working career, the second pillar recognizes and supports workers who have spent decades in the labour force.
Third-pillar initiatives are voluntary for employers and/or individuals. They include workplace registered pension plans (RPPs) and private savings (Registered Retirement Savings Plans [RRSPs] and Tax-Free Savings Accounts [TFSAs]). Through the third pillar, the federal government incentivizes the working age population to put money aside for retirement through preferential tax treatment. Generally, the third pillar is used most by higher-earning Canadians.
Taking the three pillars together, the retirement income system is the federal government’s most expensive undertaking. In 2021, OAS/GIS was the single largest budget expenditure, at about $60 billion. Retirement benefits from CPP and QPP totalled over $52 billion. An additional $52 billion of tax expenditures was used to encourage the use of workplace RPPs and private savings. Benefiting millions of Canadian seniors and their families, our retirement income system will continue to grow in significance as Canada’s population ages.
The mixed funding model of the three pillars and the measures contained within them have been a source of strength, allowing the system to be both effective and resilient over the years. In the future, it is likely that issues related to the equity and transparency of tax expenditures that support the third pillar (workplace RPPs and private savings) will require more attention. In addition, as the proportion of Canadians with a workplace pension declines, governments will need to take a closer look to ensure retirement income adequacy for middle-income earners.
Canada’s retirement income system is typically described as having three pillars. The first pillar provides benefits based on age and years of residence in Canada. It includes the Old Age Security (OAS) pension, the Guaranteed Income Supplement (GIS), the Allowance and the Age Credit.1 This first pillar is funded largely through general tax revenues and is the foundation of the retirement income system.
The second pillar consists of mandatory earnings-related programs: the Canada Pension Plan (CPP) and, in Quebec, the Quebec Pension Plan (QPP). The CPP and QPP are public pensions, funded by mandatory contributions from workers and employers as well as income from investments made with these contributions. While general tax revenue does not support these pensions, employers and workers are able to deduct contributions from their taxable income.2
The third pillar is composed of workplace registered pension plans (RPPs)3 and private savings (Registered Retirement Savings Plans [RRSPs] and Tax-Free Savings Accounts [TFSAs]). Third-pillar programs are voluntary to employers and/or individuals but they are supported and incentivized by the government through preferential tax treatment, which includes tax exemptions and tax credits.
Table 1 describes the three pillars of the retirement income system. The key elements of these pillars are discussed in greater detail in later sections of this HillStudy.
| Pillar | What Is in This Pillar? | Who Gets It? | How Does It Work? |
|---|---|---|---|
|
Pillar One |
|
|
|
|
|
||
|
|
||
|
|
||
|
|
||
|
Pillar Two |
|
|
|
|
Pillar Three |
|
|
|
|
|
Sources: Table prepared by the Library of Parliament using information obtained from Department of Finance Canada, Report on Federal Tax Expenditures: Concepts, Estimates and Evaluations 2022, 2022; Government of Canada, Old Age Security; Government of Canada, Registered Retirement Savings Plan (RRSP); Government of Canada, The Tax-Free Savings Account; and Employment and Social Development Canada, Annual report of the Canada Pension Plan for fiscal year 2020 to 2021.
In 2005, the total cost of the retirement income system was estimated at over $80 billion. By 2021, expenditures exceeded $182 billion. Although per person spending has increased, the increases in costs are largely a function of population aging. In 2005, the population aged 65 years and over was estimated at 4.1 million, and by 2021, it was estimated at 6.9 million.4 Figure 1 illustrates federal spending for each of the three pillars of the retirement income system from 2005 to 2021. It also illustrates the growth of the senior population over this period.
Figure 1 – Federal Spending on the Three Pillars of the Retirement Income System and Population Aged 65 and Over, 2005–2021
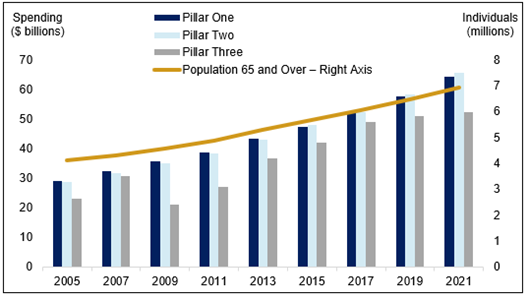
Note: Program expenditure estimates for pillars one and two are for the population aged 65 and over. Estimates are generated using tax data and are for the calendar year. Pillar One estimates include Department of Finance Canada estimates of the Age Credit. Pillar Two estimates are generated from tax data but also include Department of Finance Canada estimates on the tax expenditures related to Canada Pension Plan/Quebec Pension Plan deductions.
Sources: Figure prepared by the Library of Parliament using data obtained from Statistics Canada, “Table 11-10-0039-01: Tax filers and dependants, seniors with income by sources of income and age,” Database, accessed in May 2024; and Department of Finance Canada, Report on Federal Tax Expenditures: Concepts, Estimates and Evaluations 2022, 2022.
The first pillar – the OAS Program – is the foundation of the retirement income system. Between 2012 and 2021, OAS program spending combined with Age Credit tax expenditures rose from around $41 billion to exceed $64 billion, representing a 56% increase in spending; it has more than doubled since 2005.5
The second pillar – CPP and QPP – is related to workforce participation and is designed to replace earnings in retirement. Spending levels on CPP and QPP are similar to the first pillar when the tax treatment of contributions is considered. In 2012, federal spending was estimated at $41 billion. This increased to almost $66 billion in 2021, representing a 60% increase over the 10-year period.6
The third pillar – workplace RPPs and private savings – is the most volatile. Between 2005 and 2021, the tax expenditures that supported this pillar ranged from a low of around $18 billion during the 2008 recession to over $52 billion in 2021. The variability is a function of what is happening in financial markets and in the larger economy.7
The characteristics of each pillar, the ways in which they are supported (i.e., general tax revenues, mandatory employee/employer contributions and tax expenditures) and the distributional effects of this financing will be discussed in more detail below. While each pillar plays a significant role in supporting the system, it should be noted that individual seniors likely do not receive equal support from each pillar.
For example, under the first pillar, OAS pensions are taxed back for seniors with high income. In 2023, the maximum annual net income to be eligible to receive the OAS pension was about $143,000 for those aged 65 to 74 and $148,000 for those aged 75 and over. The minimum annual income for this recovery tax or clawback was $86,912. It is estimated that 575,000 seniors had their OAS pension clawed back to various degrees in 2023. Around 190,000 of those seniors had high enough incomes that they were not eligible to receive any support from the first pillar.8
Under the second pillar, the maximum CPP/QPP benefit in 2023 was around $1,300 per month, amounting to just over $15,000 per year. However, the average CPP/QPP retirement benefit paid out was significantly lower, at around $770 per month, or just over $9,200 per year.9
Finally, many seniors receive little to no support from the third pillar. Indeed, in 2019, 16% of seniors living in families and 36% of seniors living alone did not have any registered retirement assets (workplace RPPs, RRSPs or TFSAs).10
The OAS pension is a monthly payment available to most Canadians who are 65 years of age and over and meet the status and residency requirements. Its objective is to ensure a minimum income for seniors and to mitigate income disruptions at retirement. It was the first universal pension for Canadians, and no means test was required. The benefit was introduced in 1952, and at that time, the maximum annual benefit was $480 per year.11 By 2023, the maximum benefit exceeded $9,000 per year. In fiscal year 2022–2023, OAS pension expenditures alone exceeded $52 billion.12 The total number of OAS pensioners that year was approximately 7 million.13
Budget 2021 had announced a 10% supplement to the OAS for seniors aged 75 and older, increasing the maximum benefit to over $9,000 per year for about 3.3 million seniors in July 2022. An initial payment of $500 was provided in August 2021.14
The GIS is a monthly non-taxable benefit provided to OAS pension recipients who have a low income and are living in Canada. The benefit has always been means-tested and targets seniors with the lowest incomes. It was introduced in 1967 as a temporary measure to further reduce poverty among seniors.15 In fiscal year 2022–2023, GIS expenditures exceeded $16 billion.16 An average of 2.3 million seniors (about one‑third of OAS pensioners) received GIS payments in addition to their monthly OAS pension. To receive the GIS, these seniors were reporting annual incomes below roughly $21,000 for single seniors and $28,000 for couples.17
The Allowance was introduced in 1975. It is a benefit available to low-income individuals aged 60 to 64 who are the spouse or common-law partner of a GIS recipient. The Allowance acts like a bridge to help households with a younger spouse before they are eligible for OAS and GIS. Like GIS, it is a targeted means-tested benefit. There is also an Allowance Survivor benefit available to people whose spouse or common-law partner has died.18
Together, the OAS pension, GIS and Allowance effectively function as a minimum income floor that ensures that low-income seniors have a minimum or basic income guarantee. In 2023, the minimum guarantee for those aged between 65 and 74 was around $20,000 for single seniors and $30,000 for couples.19 This minimum income floor is funded through general tax revenues. This type of financing is commonly referred to as “pay-as-you-go” because taxes currently being paid are paying for benefits currently being received.20
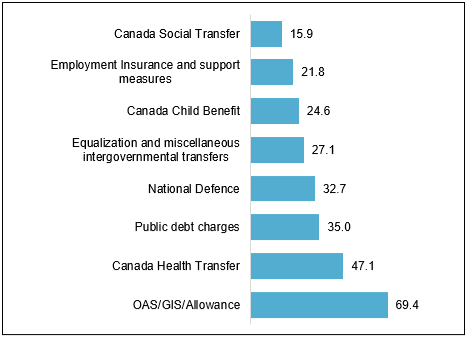
Figure 2 illustrates first-pillar (OAS/GIS/Allowance) spending in the larger context of total budgeted federal spending in fiscal year 2022–2023. At over $69 billion, it represents the largest single government transfer. Put into context, during the same year, the Canada Health Transfer was about $47 billion, fiscal arrangements with the provinces (Equalization) totalled over $27 billion, children’s benefits were over $24 billion and the Canada Social Transfer was almost $16 billion. Total budgeted federal spending for 2022–2023 was about $474 billion.21
Figure 2 – Federal Budgetary Expenditures, 2022–2023 ($ billions)
Notes:
Federal budgetary expenditures are for the government’s fiscal year beginning 1 April 2022 and ending 31 March 2023.
Both the Canada Health Transfer and the Canada Social Transfer are transferred to provincial and territorial governments.
“OAS” and “GIS” refer to Old Age Security and the Guaranteed Income Supplement, respectively.
Source: Figure prepared by the Library of Parliament using data obtained from Government of Canada, “Consolidated statement of revenues and expenses,” in “Section 1 – Summary tables and Appendices,” Public Accounts of Canada 2023 – Volume II: Details of Expenses and Revenues, 2023.
The Age Credit is a tax credit that reduces the tax burden borne by Canadian seniors. This type of preferential tax treatment is often referred to as a tax expenditure or government spending that is delivered through the tax system. Tax expenditures are discussed in greater detail in section 4 of this paper.
The credit is provided to individuals aged 65 and over. In 2023, it had a maximum value of about $1,260. It is income tested, meaning the credit amount is reduced by 15% of net income in excess of an annually indexed threshold amount ($42,335 for 2023). The credit is completely phased out at a high-income threshold ($98,309 in 2023). Any unused portion of the credit may be transferred to a spouse or common-law partner.22 In 2021, the tax expenditure associated with the Age Credit was estimated to be $4 billion.
The CPP and the QPP are public pensions funded through mandatory contributions by employers and employees, those who are self-employed and the revenue earned on investments. The QPP is administered by the Government of Quebec, and Quebec residents participate in this parallel program instead of the CPP.23
These pension plans were established in the 1960s to respond to the fact that many Canadians experienced a drastically reduced standard of living when they retired. At that time, there was growing support for an employment-based pension plan that would be portable from job to job. Eligibility is based on age, and payments are based on the amount contributed over a person’s working career. In addition to retirement benefits, the CPP and QPP include disability benefits, a survivor’s pension, children’s benefits and a death benefit. These benefits are designed to provide a modest replacement income.24
When it was introduced in 1966, the CPP was designed as a pay-as-you-go program, similar to the way in which the OAS program currently operates. This meant that the benefits for one generation would be paid largely from the contributions of later generations. This approach made sense at the time given population growth, rapid wage growth and the labour force participation rate, as well as the low rates of return on investments.
In 1997, major reforms were introduced. It was recognized that the pay-as-you-go approach would not be sustainable in the longer term. Legislative amendments were introduced to raise the level of funding. Contribution rates were increased, and the growth rate of benefits over the long term was reduced. In addition, contributions not needed to pay benefits immediately were to be invested in the financial markets through a newly created investment board, the Canada Pension Plan Investment Board.25
These legislative reforms transformed the CPP from pay-as-you-go to a steady-state model. This means that contributions will not need to increase dramatically to support a growing number of retirees. In addition, the amendments included provisions that ensured that any increases in benefits or new benefits provided under the CPP would be fully funded. In other words, any changes must follow the principle of intergenerational equity, making sure that each generation “gets what it gives” or pays for the benefits it will end up receiving. The CPP is reviewed every three years to ensure that funding requirements are being met.26
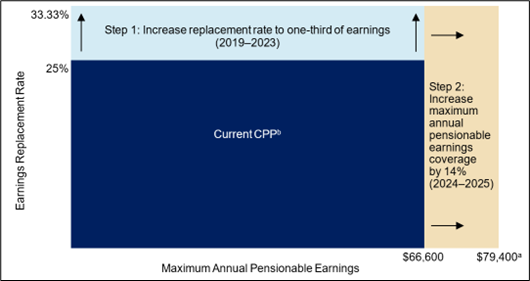
Benefits under the CPP are designed to replace a fixed proportion of a person’s average annual earnings from their working career, subject to an annual earnings ceiling. In 2016, the government enacted legislation to enhance the CPP by increasing the percentage of earnings that will be replaced and by increasing the maximum amount of annual earnings that will be covered, beginning in 2019.27 By increasing both the replacement rate and the level of maximum pensionable earnings, the second pillar will be able to support more of the weight of the retirement income system.
The CPP expansion is illustrated in Figure 3. It shows the two-stage process for CPP enhancement, which includes both an increase in the maximum earnings replacement rate and an increase in the maximum annual pensionable earnings.
Figure 3 – Design of the Canada Pension Plan Expansion
Notes:
Source: Figure prepared by the Library of Parliament using data obtained from Canada Revenue Agency, The Canada Pension Plan enhancement – Businesses, individuals and self-employed: what it means for you, Backgrounder.
Up until 2019, CPP replaced one-quarter of a contributor’s average annual earnings. Over the medium term, t he CPP pension will aim to replace about one-third of a contributor’s annual earnings. To achieve this, the contribution rate paid by workers and employers increased between 2019 and 2023. The degree to which a retiree can receive the higher pension rate will depend on how long they paid the higher contribution rate.
Put concretely, in 2018, employee and employer CPP contributions were each 4.95% of pensionable earnings. CPP expansion increased this rate gradually. In 2019, the employee and employer contributions rose to 5.10% before reaching 5.95% in 2023 so that contributions are now able to fully cover the cost of a 33.33% earnings replacement rate.
But this is only half the story. The maximum level of pensionable earnings is also increasing. Traditionally, the maximum pensionable earnings level has risen more or less at the rate of inflation. In 2022, this maximum was $64,900, and in 2023, it rose to $66,600. As part of the CPP enhancement, this maximum level of pensionable earnings will rise by 14%, higher than the rate of inflation from 2024 to 2025. The CPP expansion projects to increase the yearly maximum pensionable earnings to approximately $79,400 in 2025. This change to the earnings ceiling will have no effect on lower-income workers. Higher-income workers, however, will pay more in contributions and will in turn receive higher pension payments in retirement.28
In February 2018, the government of Quebec implemented enhancements to the QPP similar to those of the CPP. It introduced higher retirement pensions (the rate at which income is replaced will gradually increase from 25% to 33.33% by 2065) and a gradual increase in the contribution rate from 2019 to 2023, as well as an increase to the maximum annual pensionable earnings until 2025.29
The COVID-19 pandemic had an outsized impact on federal transfer payments, particularly in 2020–2021, reaching $136 billion in emergency response and recovery benefits as well as wage subsidies, more than double OAS transfer payments that year.30 The pandemic has also had a negative effect on Canadians’ retirement finances. According to one financial-service firm’s study, one-third of Canadians who planned to retire are considering a delay, mostly due to financial reasons, and two million Canadians stopped making regular retirement contributions during the pandemic.31 According to a 2020 brief from the National Association of Federal Retirees:
Individuals whose employment was disrupted by COVID-19 will also have the value of their Canada Pension Plan (CPP) retirement pension and postretirement benefit impacted, due to an extended and involuntary period without contributions.32
While this loss of income may have been short-lived for many, vulnerable youth may experience long-term impacts,33 which could result in increased social support needs down the road.
The third pillar of the retirement income system consists of workplace RPPs and private savings (RRSPs and TFSAs). These retirement savings vehicles are not mandatory government pension programs; however, the government does offer incentives through the tax system to encourage Canadians to use these plans and accounts to save for retirement. Because workplace RPPs, RRSPs and TFSAs are financed through preferential tax treatment, there is a tax expenditure cost associated with them.34
The government does acknowledge that the tax system can be an effective way to implement a policy objective. Yet using tax incentives to encourage people to save for retirement “deviates from the core function of the tax system, at the cost of lower tax revenues.” 35 In addition, tax expenditures decrease the administrative efficiency by increasing the complexity of the system. Longer forms are required. More effort on the part of taxpayers is needed to understand the system. Tax expenditures can also conflict with the neutrality of the system. Certain tax credits and deductions advantage certain types of behaviour of certain taxpayers. For example, while Canadian seniors who are married or in common-law relationships can take advantage of pension income splitting, their single (i.e., never married, divorced or widowed) counterparts cannot.36
Workplace RPPs are employer or union-sponsored plans that allow both workers and employers to contribute. These plans receive preferential tax treatment in that workers can deduct their contributions from their taxable income to reduce the amount of tax owing. When the worker begins to draw a monthly pension, this amount is then taxable, albeit often at a lower tax rate than when the individual was working.37
RRSPs are retirement savings plans offered by financial institutions in which contributions can be used to reduce income tax owing. Any investment income or interest earned in the RRSP is usually exempt from tax so long as the funds remain in the plan. Contributors pay tax when funds are withdrawn.38
The TFSA is also available from financial institutions and it allows individuals to set money aside tax-free throughout their lifetime. Contributions to a TFSA are not deductible for income tax purposes; however, income earned in the account (such as interest, dividends and capital gains) is generally tax-free.39
The Government of Canada also identifies the Pension Income Credit and pension income splitting as tax expenditures benefiting seniors.40 The Pension Income Credit allows those with eligible workplace RPP, superannuation or annuity income to claim up to $2,000 per year. Any unused portion of the tax credit may be transferred to a spouse or common-law partner. The Pension Income Credit is a non-refundable credit meaning an individual can only claim the benefit if that person has tax owing.
Pension income splitting allows a Canadian resident to transfer to a Canadian resident spouse up to 50% of eligible registered pension income for tax purposes.41 Such splitting allows couples to increase the combined amount of Pension Income Credit they can claim.42 It also reduces OAS clawbacks.
Higher-income families disproportionately benefit from tax expenditures that encourage retirement savings. This distributional impact is most apparent in the case of RRSPs. Figures 4a and 4b illustrate RRSP and workplace RPP contributions by after-tax family income, represented in quintiles. Each quintile contains 20% of all families, and families are arranged from the 20% of families with the lowest income to the 20% with the highest income. Thus, families in the highest quintile have after-tax incomes higher than 80% of the population.
Families in the highest quintile accounted for over two-thirds of all RRSP contributions.43 Not only are people in high-income families more likely to contribute to an RRSP, they are also more likely to make larger contributions. In 2023, 75% of families in the highest quintile were estimated to contribute to an RRSP. On average, they contributed $13,962 during that year.
Figure 4a – Proportion of Families that Made Workplace Registered Pension Plan (RPP) or Registered Retirement Savings Plan (RRSP) Contributions by After-Tax Family Income Quintile, 2023
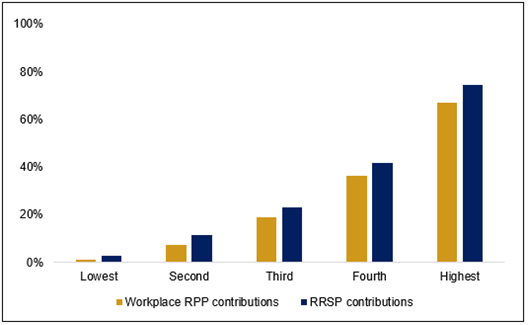
Note: The first quintile reflects the lowest after-tax family income; the fifth quintile represents the highest after-tax family income. After-tax family quintile amounts are, from lowest to highest: under $28,000; between $28,000 and $50,000; between $50,000 and $75,300; between $75,300 and $110,300; and over $110,300.
Source: Figure prepared by the Library of Parliament using data obtained from Statistics Canada, “The Social Policy Simulation Database and Model (SPSD/M),” Database, accessed October 2023.
Figure 4b – Estimated Average Workplace Registered Pension Plan (RPP) and Registered Retirement Savings Plan (RRSP) Contributions per Contributing Family by After-Tax Family Income Quintile, 2023
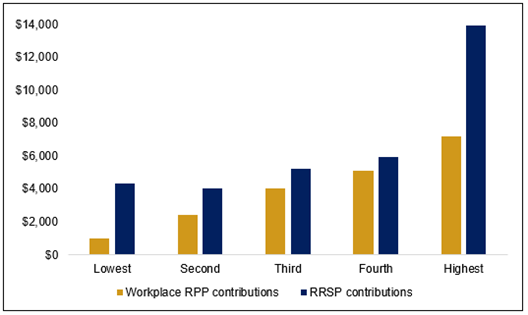
Note: The first quintile reflects the lowest after-tax family income; the fifth quintile represents the highest after-tax family income. After-tax family quintile amounts are, from lowest to highest: under $28,000; between $28,000 and $50,000; between $50,000 and $75,300; between $75,300 and $110,300; and over $110,300.
Source: Figure prepared by the Library of Parliament using data obtained from Statistics Canada, “The Social Policy Simulation Database and Model (SPSD/M),” Database, accessed October 2023.
In contrast, families in the lowest quintile accounted for around 1.6% of all contributions in 2023. This is because only 3% of the lowest-earning families contributed to an RRSP, and of those who did, the average contribution was about $4,330, less than one-third of the average contribution by the highest‑earning families.
Figure 5 illustrates the total amount of RRSP contributions by after-tax family income quintile for the 2023 tax year. It shows the compounding effect of the fact that people in high-income families who are more likely to contribute to an RRSP also likely make larger contributions.
Figure 5 – Estimated Registered Retirement Savings Plan Contributions by After-Tax Family Income Quintile, 2023 ($ millions)
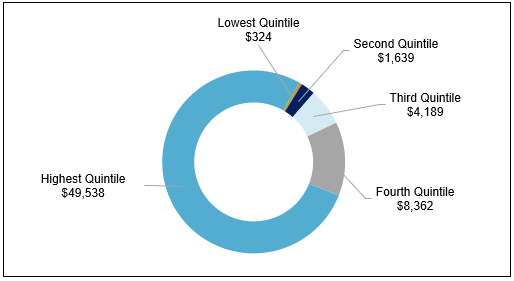
Note: The first quintile reflects the lowest after-tax family income; the fifth quintile represents the highest after-tax family income. After-tax family quintile amounts are, from lowest to highest: under $28,000; between $28,000 and $50,000; between $50,000 and $75,300; between $75,300 and $110,300; and over $110,300.
Source: Figure prepared by the Library of Parliament using data obtained from Statistics Canada, “The Social Policy Simulation Database and Model (SPSD/M),” Database, accessed in October 2023.
TFSAs are gaining in popularity and by 2020 accounted for more than half of contributions to all three registered accounts.44 Research from the Parliamentary Budget Officer (PBO) indicated that TFSAs also provide greater benefits to higher‑wealth households. By 2045, the PBO projected that families in the highest wealth quintile will gain 2.3% of income from TFSAs, while low- and middle-income families are unlikely to experience similar gains.45 Similarly, a Statistics Canada study found that the share of annual TFSA contributions by Canadian families in the highest income decile (one-tenth of the population) was almost five times as high as that of families in the bottom half in 2020.46 These benefits for wealthier Canadians come at the expense of forgone government revenues.
The disparities with respect to the distribution of benefits in the case of workplace RPPs are not quite as extreme as those of RRSPs and TFSAs. However, figures 4a and 4b illustrate that contributions to workplace RPPs similarly increase by income quintile.
In 2023, about 67% of families in the highest income quintile were estimated to participate in a workplace RPP, with an average contribution of $7,209. Conversely, participation among families in the lowest income quintile was only 2%, and their average contributions ($981) were substantially lower than other quintiles. This is not surprising given that higher-paying jobs are more likely to come with pensions and the dollar amount of pension contributions increases with salary level.
Perhaps the more important insight from the data is that about 58% of people who participated in a workplace RPP also made an RRSP contribution, while only 21% of people without any workplace RPP contributions invested in an RRSP. It suggests that RRSPs may not be an effective substitute for people who are not able to participate in a workplace RPP.47
As with RRSPs, there is a compounding effect gained from the use of pension income-splitting deductions. In 2023, it is estimated that only 11.4% of seniors belonging to families with after-tax income under $50,000 benefited from pension income splitting. Conversely, 60.3% of families with after-tax family income between $75,300 and $110,000 used pension income-splitting deductions. Moreover, families with after-tax income greater than $75,300 accounted for 84% of the value of total pension income-splitting deductions.48
The government delivers the retirement income system through two main instruments:
Information related to OAS and CPP/QPP program spending is accessible to anyone with an Internet connection. Employment and Social Development Canada (ESDC), the Treasury Board of Canada, the Office of the Superintendent of Financial Institutions and the Office of the Chief Actuary regularly publish data, statistics and detailed reports on program costs and the population receiving benefits. In addition, the Financial Administration Act requires ESDC to review the relevance and effectiveness of these programs every five years.49
In contrast, information related to the tax expenditures that support workplace RPPs, RRSPs, TFSAs and pension income splitting (even to a certain extent the tax expenditures that support worker contributions to CPP and QPP) is more difficult to find, especially with respect to the population that accesses and benefits from these tax expenditures.
While government accounting best practices do take the reporting of tax expenditures into account, it is difficult to compare tax expenditures with program spending, even when they may serve a similar purpose. There is also no requirement that they be evaluated. Moreover, unlike all other public expenditures, there is not currently an established process for parliamentarians to review tax expenditures.50
Finally, it is noted that private members’ legislation is not allowed to call for new program spending without a Royal Recommendation.51 However, private members’ legislation may decrease a tax or expenditure, though this rarely happens.52
Figure 6 provides another snapshot of the financing of Canada’s retirement income system. It compares program spending with tax expenditures. In 2021, the cost of program spending on OAS, GIS, CPP and QPP totalled $111 billion. That same year, the cost of tax expenditures related to seniors was $70 billion.53
Figure 6 – Program Spending and Tax Expenditures that Support the Retirement Income System, 2021 ($ billions)
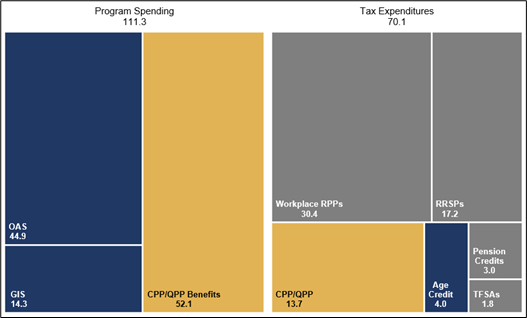
Note: The first pillar is shown in dark blue, the second pillar in yellow and the third pillar in grey. Pension credits include the Pension Income Credit and pension income splitting. While the Quebec Pension Plan (QPP) is not administered by the federal government, it acts as a substitute for the Canada Pension Plan (CPP) for residents of Quebec. To consider the costs of retirement nationally, QPP is included. Tax expenditures related to CPP/QPP refer to only the federal tax treatment of contributions to these programs.
Sources: Figure prepared by the Library of Parliament using data obtained from Statistics Canada, “Table 11-10-0039-01: Tax filers and dependants, seniors with income by source of income and age,” Database, accessed October 2023; and Government of Canada, Public Accounts of Canada 2021 – Volume II: Details of Expenses and Revenues, 2021.
Canada’s retirement income system, with its three pillars and mixed funding approaches, has proven remarkably resilient over the years. Ensuring that benefits are adequate while respecting intergenerational fairness and sustainability will always be challenging. Much of the cost of the retirement income system is borne by working-age Canadians, and the financial significance of the system can limit government funds available for programs that benefit younger Canadians. Yet the system offers policymakers a range of tools that can be used to address these challenges and adapt to changing conditions.
Moving forward, it is likely that issues related to the equity and transparency of tax expenditures that support the third pillar (workplace RPPs and private savings) will require more attention. In addition, as the proportion of Canadians with a workplace pension declines, governments may need to take a closer look at future retirement income adequacy for middle income earners.54
 (8.55 MB, 161 pages), Fall 2022, p. 150. [ Return to text ] (8.55 MB, 161 pages), Fall 2022. [ Return to text ] (647 KB, 40 pages), Discussion paper, Experts Panel on Income Security, Council on Aging of Ottawa, June 2019, p. 18; and ESDC, Evaluation of the Old Age Security program: Phase 2. [ Return to text ] (1.60 MB, 29 pages), July 2022, pp. 4 and 23. [ Return to text ] (377 KB, 11 pages), Brief to the House of Commons Standing Committee on Human Resources, Skills and Social Development and the Status of Persons with Disabilities, 25 May 2020. [ Return to text ] (5.46 MB, 395 pages) 2024, 2024. [ Return to text ] (638 KB, 42 pages), June 2021; and Allen Buckley, “Do Tax-Qualified Plans Still Make Sense?,” Journal of Pension Benefits, Vol. 18, No. 3, 2011, pp. 60–61. [ Return to text ] (5.46 MB, 395 pages), 2024, p. 36. Note that the Department of Finance Canada also identifies non‑taxation of Guaranteed Income Supplement [GIS] and Allowance benefits and the Home Accessibility Tax Credit as tax expenditures benefiting seniors. (The cost of non-taxation of GIS and Allowance benefits and the Home Accessibility Tax Credit expenditures was estimated to be $235 million in 2021.) Since the non-taxation of GIS and Allowance benefits and the Home Accessibility Tax Credit are an order of magnitude less than other tax expenditures that benefit seniors, they are not discussed at length in this HillStudy. [ Return to text ] (5.46 MB, 395 pages), 2024, p. 19. [ Return to text ] (220 KB, 3 pages), 27 April 2015. See also Trevor Shaw, The Tax-Free Savings Account (745 KB, 35 pages), PBO, 24 February 2015; and Richard Shillington, Are Low-Income Savers Still in the Lurch? TFSAs at 10 Years, Institute for Research on Public Policy, 9 April 2019. [ Return to text ] (6.94 MB, 426 pages), 2023; ESDC, Annual report of the Canada Pension Plan for fiscal year 2020 to 2021; and OSFI, Office of the Chief Actuary, Actuarial Report (18th) on the Old Age Security Program as at 31 December 2021, 27 June 2023. [ Return to text ]
[ Return to text ][S]ection 54 of the Constitution Act, 1867 has been summarized by Eugene Forsey in the following terms: “It [the cabinet] has the sole power to prepare and introduce bills providing for the expenditure of public money.” This is known as the Royal Recommendation as the purpose behind the appropriation of public funds is recommended to the House of Commons by Message of the Governor General.
(2.25 MB, 59 pages), 10th ed., Library of Parliament, Ottawa, 2020, p. 6. See also Senate, Rules of the Senate of Canada, October 2020, Rule 10-7; House of Commons, Standing Orders of the House of Commons – Consolidated version as of April 20, 2020, Standing Order 79(1); and House of Commons, “Private Members’ Business,” Our Procedure. [ Return to text ] (1.44 MB, 30 pages), National Institute of Aging, February 2020. See also Bob Baldwin, Canada’s Retirement Income System: A Reform Agenda (647 KB, 40 pages), discussion paper, Council on Aging of Ottawa, June 2019, p. 18. [ Return to text ]© Library of Parliament